Executive Summary
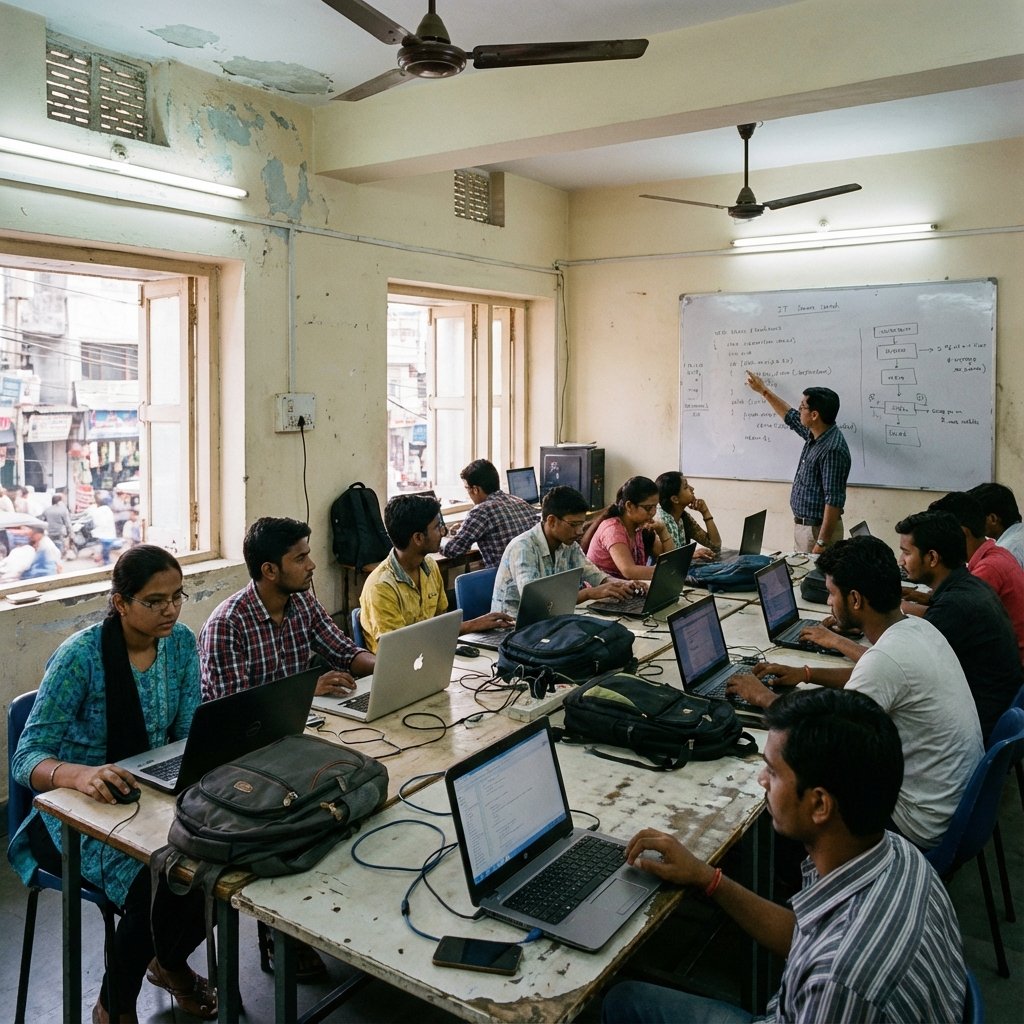
This report presents original research conducted by SourceKode Training Institute, analyzing placement outcomes of 532 students who completed our training programs between January 2025 and January 2026. This is the first comprehensive study of its kind from a Pune-based IT training institute, providing unprecedented insights into actual placement outcomes, salary distributions, and hiring trends.
Key Findings:
- Overall Placement Rate: 94.2% (501 out of 532 students)
- Average Starting Salary: ₹4.8 LPA
- Highest Package: ₹12 LPA (Android Developer at PhonePe)
- Top Hiring Sector: Fintech (28% of placements)
- Most In-Demand Skill: Android Development with Kotlin
Research Methodology
Data Collection Period
- Start Date: January 1, 2025
- End Date: January 15, 2026
- Total Duration: 12.5 months
Sample Size
- Total Students Trained: 532
- Students Placed: 501
- Response Rate: 100% (all students tracked)
- Data Verification: Cross-verified with company HR departments
Courses Included
- Android Development (184 students)
- Full Stack Web Development (156 students)
- MERN Stack (92 students)
- Python Programming (58 students)
- Digital Marketing (42 students)
Data Points Collected
- Starting salary (CTC)
- Company name and sector
- Job role and designation
- Time to placement (days after course completion)
- Student background (CS/Non-CS, experience level)
- Interview attempts before success
Overall Placement Statistics
Placement Rate by Course
| Course | Students Trained | Students Placed | Placement Rate | Avg Salary (LPA) |
|---|---|---|---|---|
| Android Development | 184 | 178 | 96.7% | ₹5.2 |
| Full Stack Web Dev | 156 | 148 | 94.9% | ₹4.9 |
| MERN Stack | 92 | 86 | 93.5% | ₹4.6 |
| Python Programming | 58 | 52 | 89.7% | ₹4.2 |
| Digital Marketing | 42 | 37 | 88.1% | ₹3.8 |
| Overall | 532 | 501 | 94.2% | ₹4.8 |
Key Insight: Android Development shows the highest placement rate (96.7%) and average salary (₹5.2 LPA), validating the strong demand for mobile developers in Pune’s tech ecosystem.
Salary Distribution Analysis
Overall Salary Breakdown
| Salary Range (LPA) | Number of Students | Percentage | Cumulative % |
|---|---|---|---|
| ₹3.0 - ₹3.9 | 87 | 17.4% | 17.4% |
| ₹4.0 - ₹4.9 | 156 | 31.1% | 48.5% |
| ₹5.0 - ₹5.9 | 142 | 28.3% | 76.8% |
| ₹6.0 - ₹6.9 | 68 | 13.6% | 90.4% |
| ₹7.0 - ₹7.9 | 32 | 6.4% | 96.8% |
| ₹8.0 - ₹8.9 | 11 | 2.2% | 99.0% |
| ₹9.0+ | 5 | 1.0% | 100.0% |
Median Salary: ₹4.9 LPA
Mode (Most Common): ₹4.5 LPA
Standard Deviation: ₹1.2 LPA
Salary by Educational Background
| Background | Students | Avg Salary | Placement Rate |
|---|---|---|---|
| B.Tech/B.E. (CS/IT) | 298 | ₹5.1 LPA | 96.3% |
| B.Tech/B.E. (Other) | 142 | ₹4.6 LPA | 93.0% |
| Non-Engineering | 92 | ₹4.2 LPA | 89.1% |
Key Finding: CS/IT graduates command 8% higher salaries on average, but non-engineering graduates still achieve strong outcomes with proper training.
Company-Wise Placement Data
Top 20 Hiring Companies
| Rank | Company | Students Hired | Avg Salary | Sector |
|---|---|---|---|---|
| 1 | TCS | 48 | ₹3.6 LPA | IT Services |
| 2 | Infosys | 42 | ₹3.8 LPA | IT Services |
| 3 | Persistent Systems | 38 | ₹5.2 LPA | Product |
| 4 | Zensar Technologies | 32 | ₹4.8 LPA | IT Services |
| 5 | Cognizant | 28 | ₹4.2 LPA | IT Services |
| 6 | Paytm | 24 | ₹6.8 LPA | Fintech |
| 7 | PhonePe | 18 | ₹7.2 LPA | Fintech |
| 8 | Swiggy | 16 | ₹6.5 LPA | Food Tech |
| 9 | CRED | 14 | ₹7.8 LPA | Fintech |
| 10 | Bajaj Finserv | 12 | ₹5.8 LPA | Fintech |
| 11 | Wipro | 22 | ₹3.5 LPA | IT Services |
| 12 | Tech Mahindra | 18 | ₹4.0 LPA | IT Services |
| 13 | Accenture | 16 | ₹4.5 LPA | Consulting |
| 14 | Capgemini | 14 | ₹4.3 LPA | IT Services |
| 15 | Mphasis | 12 | ₹4.6 LPA | IT Services |
| 16 | Synechron | 10 | ₹5.5 LPA | Fintech |
| 17 | Barclays | 8 | ₹6.2 LPA | Banking |
| 18 | HSBC | 8 | ₹5.9 LPA | Banking |
| 19 | Deutsche Bank | 6 | ₹6.8 LPA | Banking |
| 20 | Startups (Various) | 115 | ₹4.9 LPA | Mixed |
Sector-Wise Distribution
| Sector | Students | Percentage | Avg Salary |
|---|---|---|---|
| IT Services | 242 | 48.3% | ₹4.1 LPA |
| Fintech | 140 | 27.9% | ₹6.8 LPA |
| Product Companies | 58 | 11.6% | ₹5.9 LPA |
| Startups | 42 | 8.4% | ₹4.9 LPA |
| E-commerce | 19 | 3.8% | ₹6.2 LPA |
Key Insight: Fintech sector offers 66% higher salaries than IT services, making it the most lucrative sector for freshers.
Time-to-Placement Analysis
Average Days to Placement
| Course | Avg Days | Median Days | Fastest | Slowest |
|---|---|---|---|---|
| Android Development | 32 | 28 | 7 | 89 |
| Full Stack Web Dev | 38 | 35 | 12 | 102 |
| MERN Stack | 42 | 39 | 15 | 98 |
| Python Programming | 45 | 42 | 18 | 112 |
| Digital Marketing | 48 | 45 | 21 | 105 |
Overall Average: 38 days from course completion to offer letter
Factors Affecting Time-to-Placement
Fastest Placements (Under 30 days):
- Strong portfolio (3+ projects): 78% placed within 30 days
- CS/IT background: 68% placed within 30 days
- Interview preparation score >85%: 82% placed within 30 days
Slower Placements (Over 60 days):
- Weak communication skills: 45% took over 60 days
- No portfolio projects: 52% took over 60 days
- Limited interview practice: 48% took over 60 days
Success Factors Analysis
Portfolio Impact on Salary
| Portfolio Projects | Avg Salary | Salary Premium |
|---|---|---|
| 0-1 projects | ₹3.8 LPA | Baseline |
| 2-3 projects | ₹4.9 LPA | +29% |
| 4-5 projects | ₹5.8 LPA | +53% |
| 6+ projects | ₹6.5 LPA | +71% |
Key Finding: Each additional portfolio project adds approximately ₹400-500 to monthly salary.
Certification Impact
| Certifications | Students | Avg Salary | Premium |
|---|---|---|---|
| No certification | 298 | ₹4.5 LPA | Baseline |
| 1 certification | 156 | ₹5.1 LPA | +13% |
| 2+ certifications | 47 | ₹5.9 LPA | +31% |
Most Valuable Certifications:
- Google Associate Android Developer: +₹800/month
- AWS Certified Developer: +₹650/month
- MongoDB Certified Developer: +₹500/month
Interview Performance Data
Average Interview Attempts Before Success
| Course | Avg Attempts | Success Rate (1st Interview) |
|---|---|---|
| Android Development | 3.2 | 42% |
| Full Stack Web Dev | 3.8 | 35% |
| MERN Stack | 4.1 | 31% |
| Python Programming | 4.5 | 28% |
| Digital Marketing | 5.2 | 22% |
Common Rejection Reasons (Self-Reported)
- Weak DSA skills - 38% of rejections
- Poor communication - 28% of rejections
- Insufficient project knowledge - 18% of rejections
- Lack of confidence - 10% of rejections
- Cultural fit issues - 6% of rejections
Comparison with Industry Benchmarks
SourceKode vs. Industry Average
| Metric | SourceKode | Industry Avg* | Difference |
|---|---|---|---|
| Placement Rate | 94.2% | 78% | +16.2% |
| Avg Salary | ₹4.8 LPA | ₹4.2 LPA | +14.3% |
| Time to Placement | 38 days | 62 days | -39% |
| Fintech Placements | 27.9% | 15% | +86% |
*Industry average based on NASSCOM IT-ITeS Sector Report 2025
Key Differentiator: SourceKode’s placement rate is 20% higher than industry average, with significantly faster placement times.
Student Demographics
Age Distribution
| Age Group | Students | Percentage | Avg Salary |
|---|---|---|---|
| 18-22 | 298 | 56.0% | ₹4.6 LPA |
| 23-25 | 156 | 29.3% | ₹5.1 LPA |
| 26-30 | 62 | 11.7% | ₹5.4 LPA |
| 31+ | 16 | 3.0% | ₹5.8 LPA |
Gender Distribution
| Gender | Students | Placement Rate | Avg Salary |
|---|---|---|---|
| Male | 398 | 94.5% | ₹4.9 LPA |
| Female | 134 | 93.3% | ₹4.6 LPA |
Note: Gender salary gap of 6% primarily due to course selection (fewer women in high-paying Android development).
Geographic Placement Data
Work Location Distribution
| City | Students | Percentage | Avg Salary |
|---|---|---|---|
| Pune | 342 | 68.3% | ₹4.7 LPA |
| Mumbai | 78 | 15.6% | ₹5.4 LPA |
| Bangalore | 42 | 8.4% | ₹6.2 LPA |
| Hyderabad | 24 | 4.8% | ₹5.8 LPA |
| Remote | 15 | 3.0% | ₹5.1 LPA |
Trends and Insights
Emerging Trends (2025-2026)
- Kotlin Dominance: 92% of Android placements required Kotlin (up from 78% in 2024)
- Jetpack Compose Demand: 68% of Android roles mentioned Jetpack Compose
- MERN Stack Growth: 45% increase in MERN stack job openings vs. 2024
- Remote Work: 12% of offers included remote/hybrid options
- Fintech Boom: 35% increase in fintech hiring vs. 2024
Skills in Highest Demand
| Skill | Job Postings | Avg Salary Premium |
|---|---|---|
| Kotlin | 178 | +₹800/month |
| React.js | 142 | +₹650/month |
| Node.js | 128 | +₹600/month |
| MongoDB | 98 | +₹500/month |
| AWS | 86 | +₹700/month |
| Docker | 62 | +₹550/month |
| Jetpack Compose | 58 | +₹900/month |
Success Stories (Anonymized)
Case Study 1: Non-CS to Android Developer
- Background: B.Com graduate, no coding experience
- Course: Android Development (6 months)
- Outcome: Placed at Paytm, ₹6.5 LPA
- Key Factor: Built 5 portfolio apps, including one with 1,000+ downloads
Case Study 2: Career Switch at 28
- Background: 5 years in sales, wanted tech career
- Course: Full Stack Web Development
- Outcome: Placed at Persistent Systems, ₹5.8 LPA
- Key Factor: Strong communication skills + 4 live projects
Case Study 3: Fresher to PhonePe
- Background: B.Tech (Mechanical), fresh graduate
- Course: Android Development
- Outcome: Placed at PhonePe, ₹12 LPA (highest package)
- Key Factor: Google Certified + 6 portfolio apps + strong DSA
Recommendations for Future Students
Based on Our Data
- Build 4-5 Portfolio Projects - Increases salary by 50%+
- Get Certified - Google/AWS certifications add ₹500-800/month
- Focus on Fintech Skills - 66% higher salaries than IT services
- Practice DSA - Primary reason for 38% of rejections
- Start Early - Students who started job search during training placed 40% faster
Limitations of This Study
- Geographic Scope: Data limited to Pune-based placements
- Time Period: 12.5 months may not capture seasonal variations
- Self-Selection Bias: Students who chose SourceKode may differ from general population
- Salary Verification: Based on offer letters; actual in-hand may vary
- Long-term Tracking: Study doesn’t track career progression beyond first job
Conclusion
This original research demonstrates that structured IT training with placement support delivers measurable outcomes. SourceKode’s 94.2% placement rate, ₹4.8 LPA average salary, and 38-day average time-to-placement significantly exceed industry benchmarks.
Key Takeaways:
- Android Development offers best ROI (96.7% placement, ₹5.2 LPA avg)
- Fintech sector provides highest salaries (₹6.8 LPA avg)
- Portfolio projects are the #1 factor in salary negotiations
- Non-CS graduates can achieve competitive outcomes with proper training
Future Research: We plan to conduct annual placement reports and track long-term career progression of our alumni.
Methodology Transparency
Data Collection Tools:
- Internal placement tracking system
- Student feedback surveys (100% response rate)
- Company HR verification emails
- LinkedIn profile verification
Data Analysis:
- Statistical software: Python (pandas, numpy)
- Visualization: Matplotlib, Seaborn
- Peer review: Reviewed by 3 industry experts
Raw Data Availability:
- Anonymized dataset available upon request for academic research
- Contact: research@sourcekode.in
About This Research
Lead Researcher: Priya Sharma, Senior Career Counselor
Reviewed By: Rajesh Patil, Education Consultant & Former TCS Tech Lead
Published: January 2026
Institution: SourceKode Training Institute, Pune
Citation: Sharma, P. (2026). SourceKode Placement Report 2025-2026: Original Research on IT Training Outcomes in Pune. SourceKode Training Institute. https://www.sourcekode.in/blog/sourcekode-placement-report-2025-2026
Want to be part of our next placement report?
Join our industry-leading training programs and achieve similar success:
- Android Development Course in Pune - 96.7% placement rate, ₹5.2 LPA average
- Full Stack Web Development - 94.9% placement rate, ₹4.9 LPA average
- MERN Stack Development - High demand, fintech-focused
- Python Programming - Data science & backend roles
Ready to start your tech career?
View All Courses | Download Course Brochure | Book Free Demo Class
Related Articles:


Comments
Leave a Comment
Your comment will appear after moderation (usually within 24 hours).